
 OnTarget · Report concept
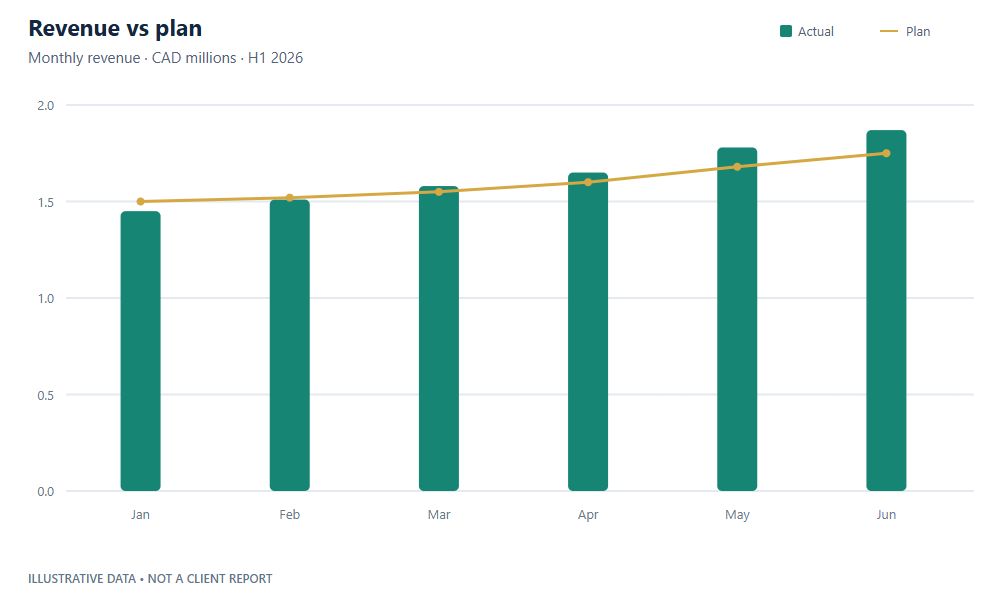
Are we delivering against plan?
Compare monthly revenue with the agreed plan. Use the variance to focus the commercial and operational review.
Open full-size imagePower BI · Decision intelligence
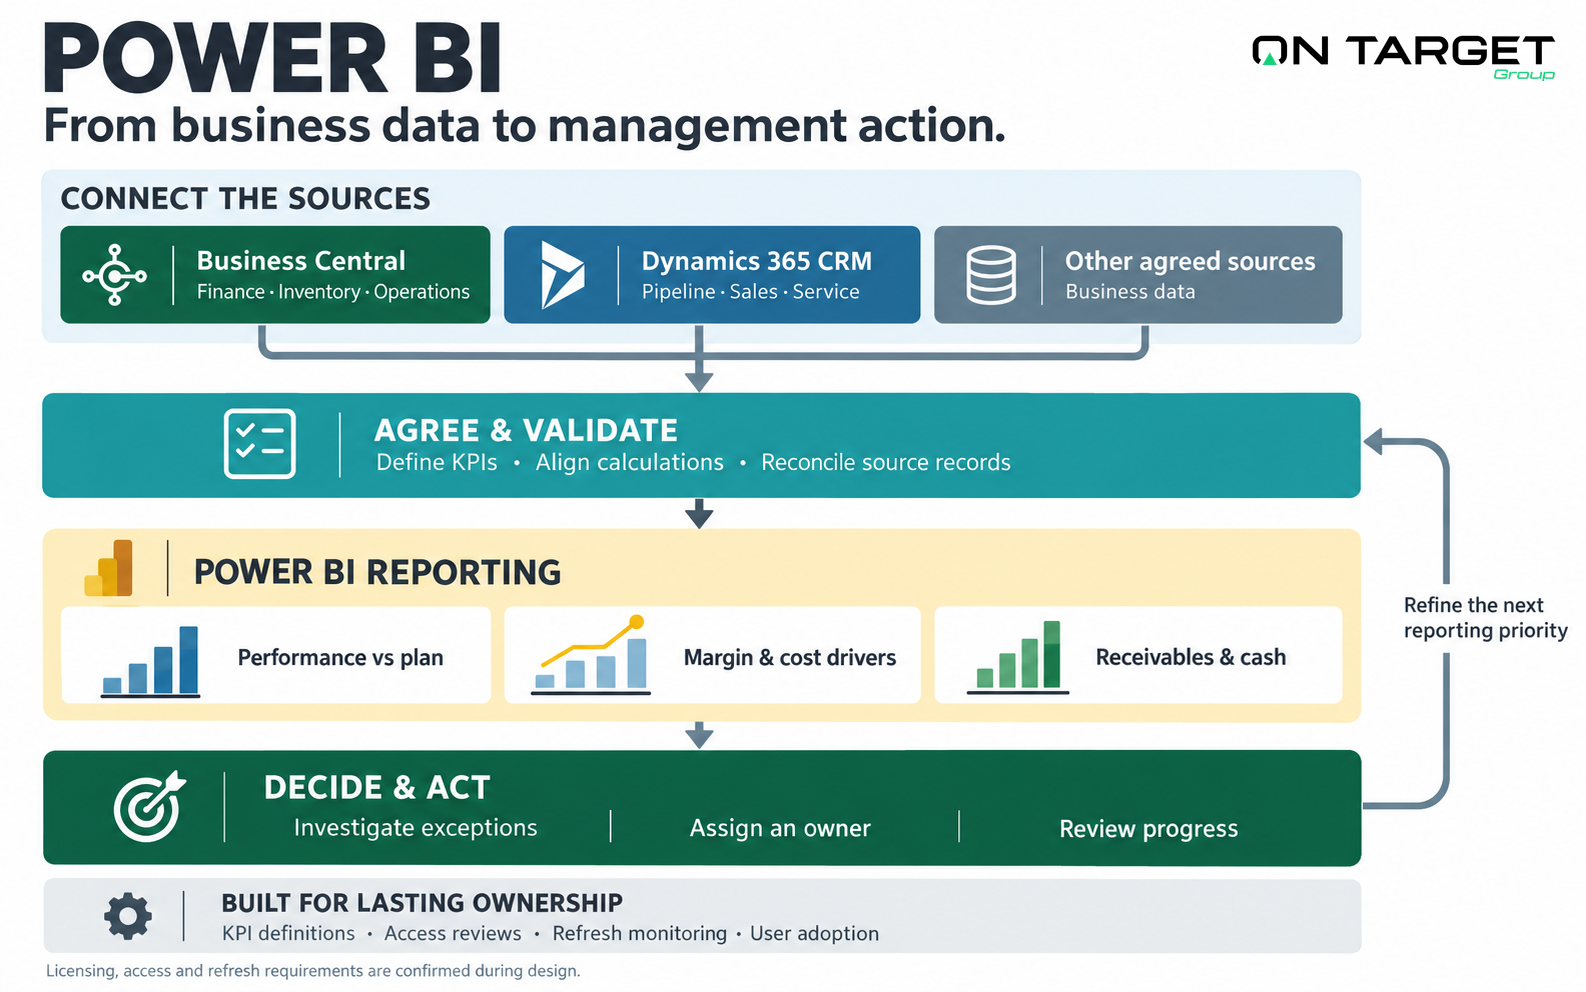
Bring financial, commercial and operational data into a shared view of performance. OnTarget designs Power BI reporting around the decisions your leadership team needs to make.
The executive view
Start with a concise leadership view, then investigate the business unit, account or period behind a variance. These concepts show how a reporting brief can become a focused decision tool.
CAD millions · Monthly actual and budget
June · Actual / target
| Month | Actual (M$) | Budget (M$) | Variance |
|---|---|---|---|
| Jan | 1.45 | 1.50 | -3.3% |
| Feb | 1.51 | 1.52 | -0.7% |
| Mar | 1.58 | 1.55 | +1.9% |
| Apr | 1.65 | 1.60 | +3.1% |
| May | 1.78 | 1.68 | +6.0% |
| Jun | 1.87 | 1.75 | +6.9% |
Interactive report concepts and sample charts, not live Power BI reports or client results. Change the executive reporting period to explore the figures. Data is fictional, in Canadian dollars, for the first half of 2026.
From a signal to a decision
Compare monthly revenue with the agreed plan. Use the variance to focus the commercial and operational review.
Open full-size image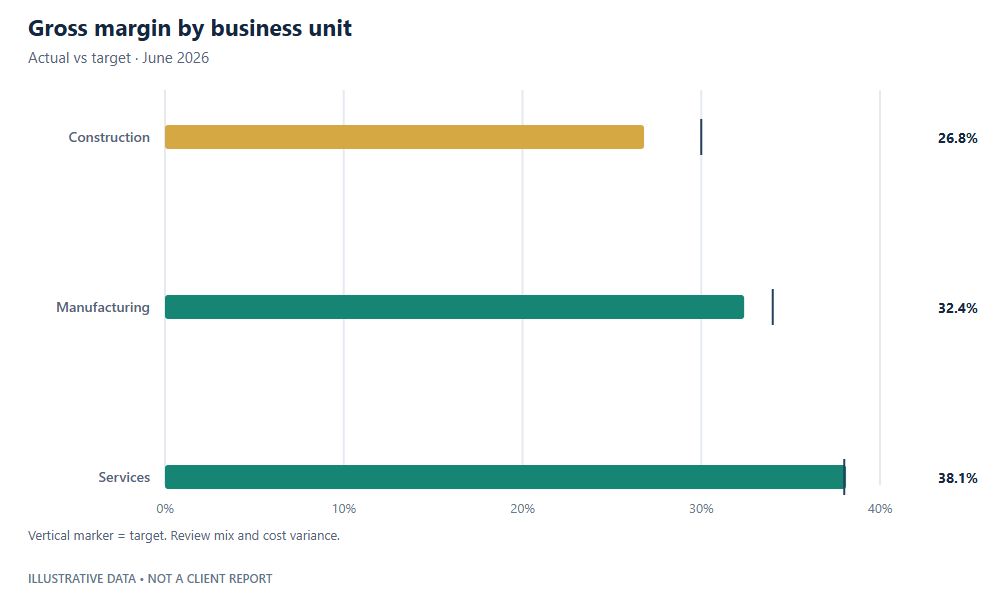
Compare business units with their own targets, then investigate pricing, mix and cost drivers before deciding on corrective action.
Open full-size image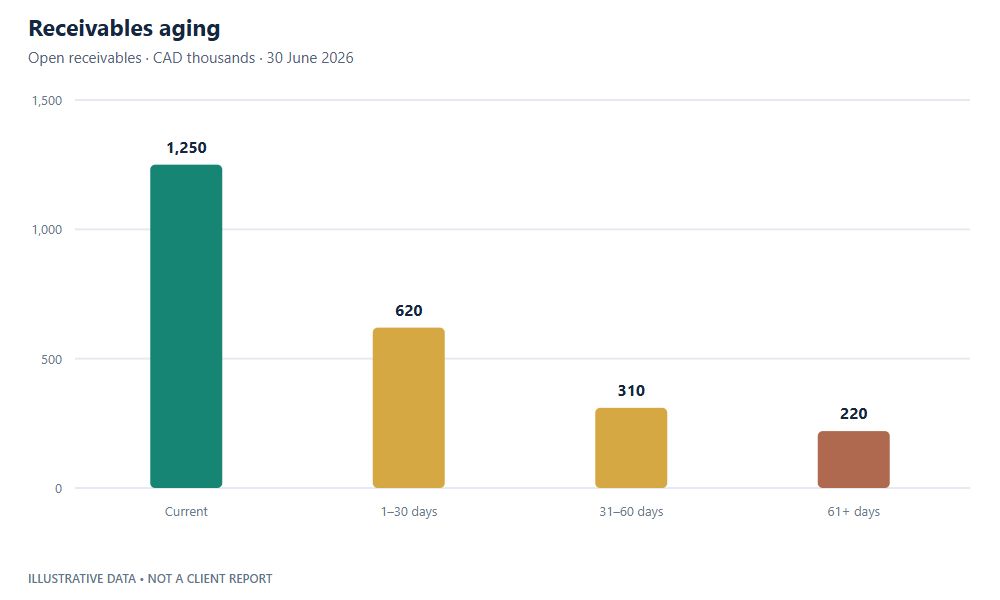
Separate current and overdue receivables so finance can assign collection priorities and review payment commitments.
Open full-size image| Metric | Sample value | Comparison / definition |
|---|---|---|
| H1 revenue | CAD 9.84M | CAD 9.60M plan; +2.5% |
| June gross margin | 31.4% | 33.0% target |
| Cash balance | CAD 1.26M | At 30 June 2026 |
| Receivable days | 47 | 45-day target |
| Open receivables | CAD 2.40M | Current 1.25M + overdue 1.15M |
| Overdue receivables | CAD 1.15M | 47.9% of open receivables |
| Inventory value | CAD 3.18M | At 30 June 2026 |
Beyond the dashboard
01
Agree who uses the report, which decisions it supports and what deserves escalation. Start with a focused reporting brief.
02
Define each KPI, its owner, calculation, target and reporting period. Reconcile financial measures with the agreed source records.
03
Review source systems, data quality and refresh needs. Build the model and test totals, filters and access with the people responsible.
04
Prepare the audience, document definitions and assign responsibility for refresh monitoring, access reviews and future changes.
Reporting can bring together Business Central, Dynamics 365 CRM and other agreed sources. The design starts with the records you trust and the questions you need to answer.
Scope depends on your source systems, data condition, KPI definitions, audience and access requirements. Licensing, sharing, connectivity and refresh frequency are confirmed during design; they are not assumed to be included with an existing Microsoft subscription.
See how we define scope, validate the solution and prepare your team.
Meet the practice leaders behind your financial and operational systems.
Show us the spreadsheet, board pack or dashboard you use today. Together, we can identify the decisions it should support and the first reporting view worth building.